By Nate Auchter
With the release of the Project for the web Power BI template, we now have visibility into the projects managed by the new Project for the web service. Hidden inside the template are the queries and supporting report pages for Roadmap data. This allows you to report on key dates and roadmap row items.
The report template contains two hidden pages that offer visualizations on the roadmap data:
Note: At the time that this article was published, users connecting to the CDS to report on Roadmap data were required to have read permissions at the business-unit level to the CDS entities (Roadmap included) to which the report connects to have a portfolio-level view of the data. This can be accomplished by having your Global Administrator create a new security role in the Dynamics 365 Admin center through Settings > Security > Security Roles > New. This new role needs to have Read access at the business-unit level to the Roadmap entities. The role would then be assigned to the users who require permissions to view and refresh the report data.
|
ENABLING THE ROADMAP QUERIES |
|
|
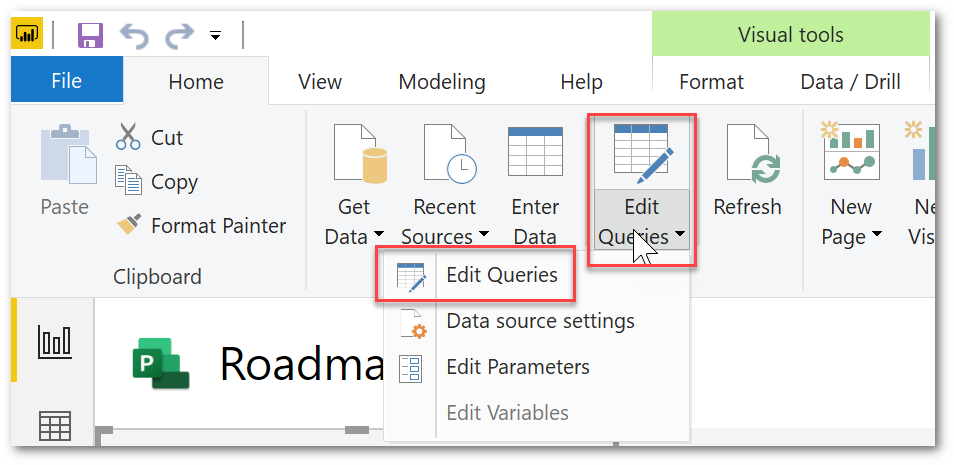
Once you’ve completed the initial data load from your CDS into the Power BI report, you’ll then need to enable the roadmap queries. In order to get the Roadmap data into the report, there are several queries that need to be enabled in the Power Query Editor. To do this, follow the steps below:
|
|
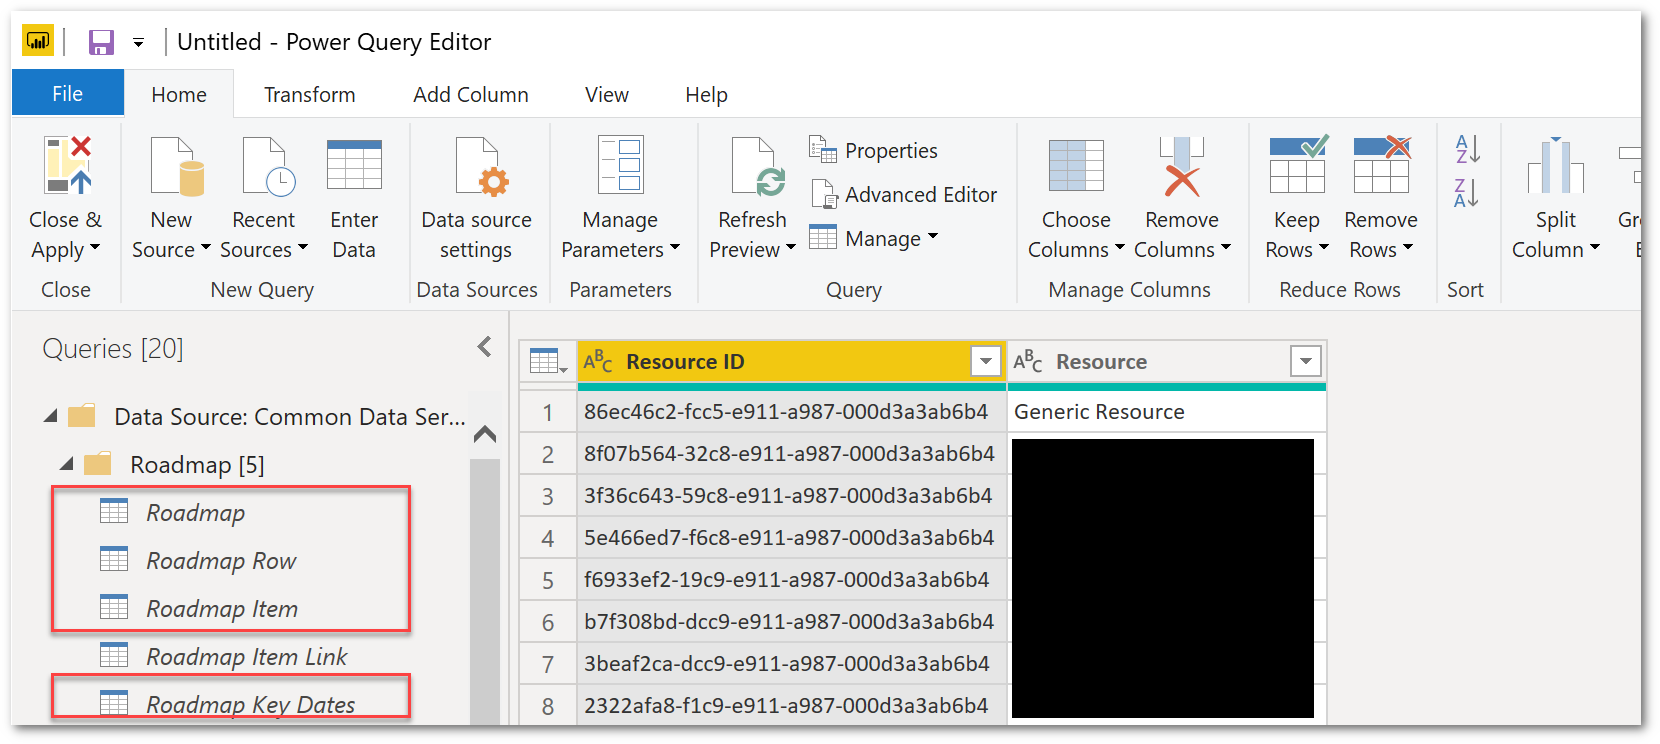
| 2. On the left-hand side of the window, you’ll find the Queries pane; there are four queries that relate to Roadmap data that need to be enabled.
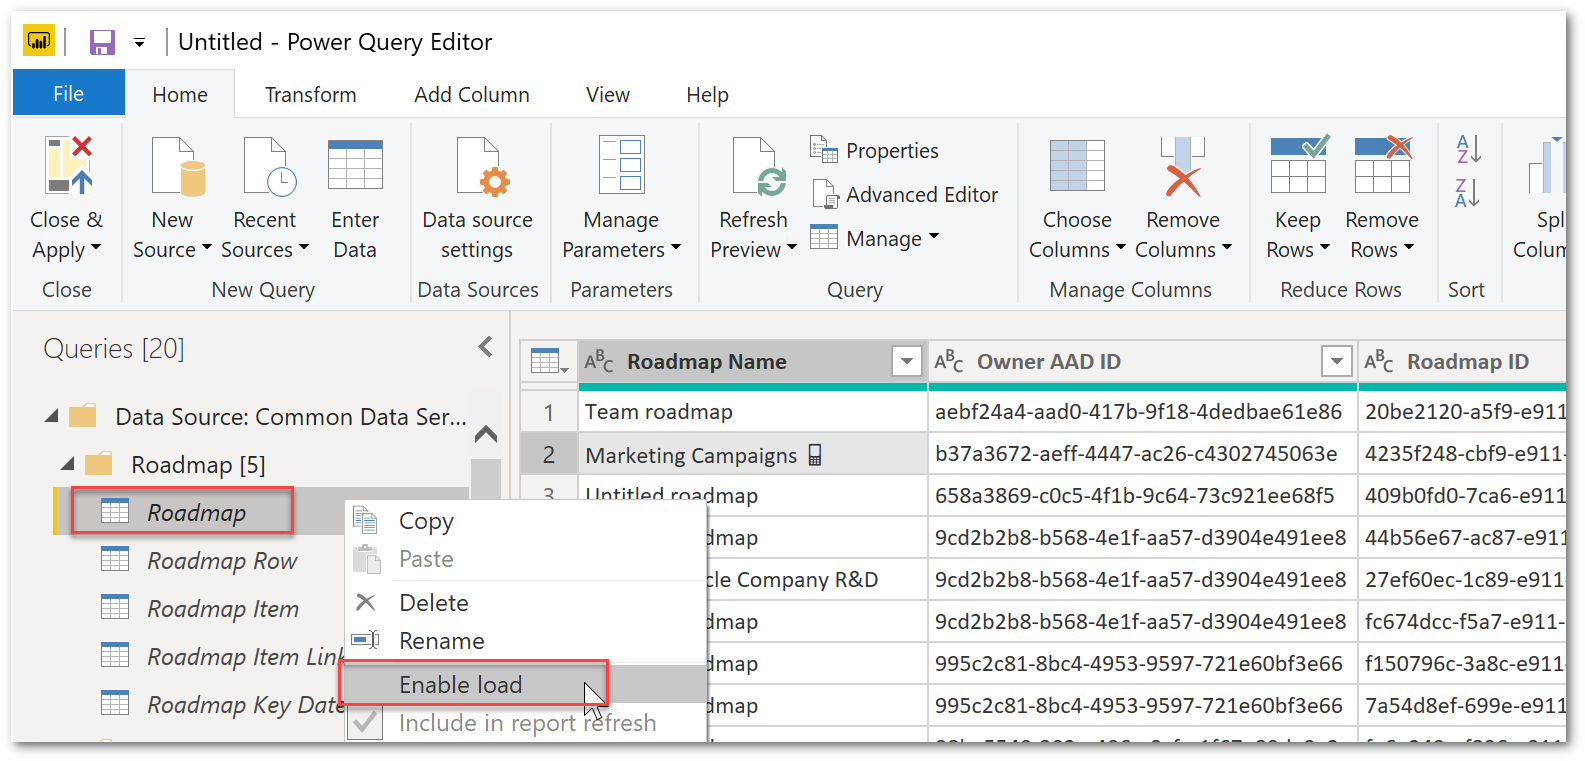
3. To enable the queries, right-click each query, and then click ‘Enable Load’. Repeat this step for each of the other ‘Roadmap’ queries listed below (Note: the Roadmap Item Link query does not need to be loaded):
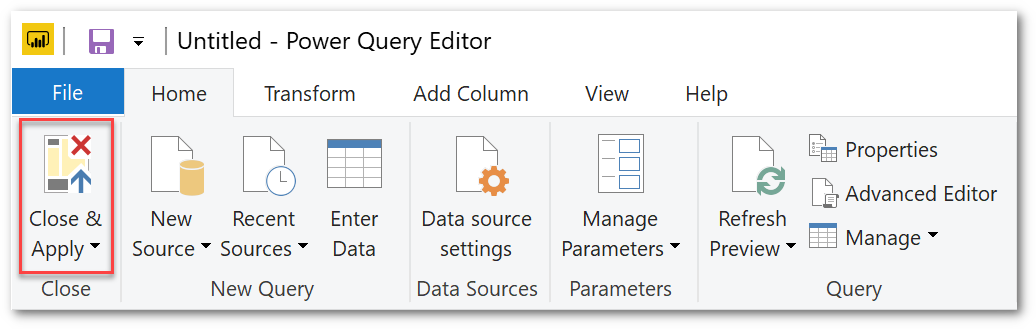
4. From the ‘Home ribbon > Close section’ click ‘Close & Apply’.
5. The data from the Roadmap queries will load into the report. |
|
| ADJUSTING THE MODEL | |
| With this specific file, the setting for ‘Autodetect new relationships after data is loaded’ has been disabled. This means there are a few relationships that need to be created. To create them, complete the steps below:
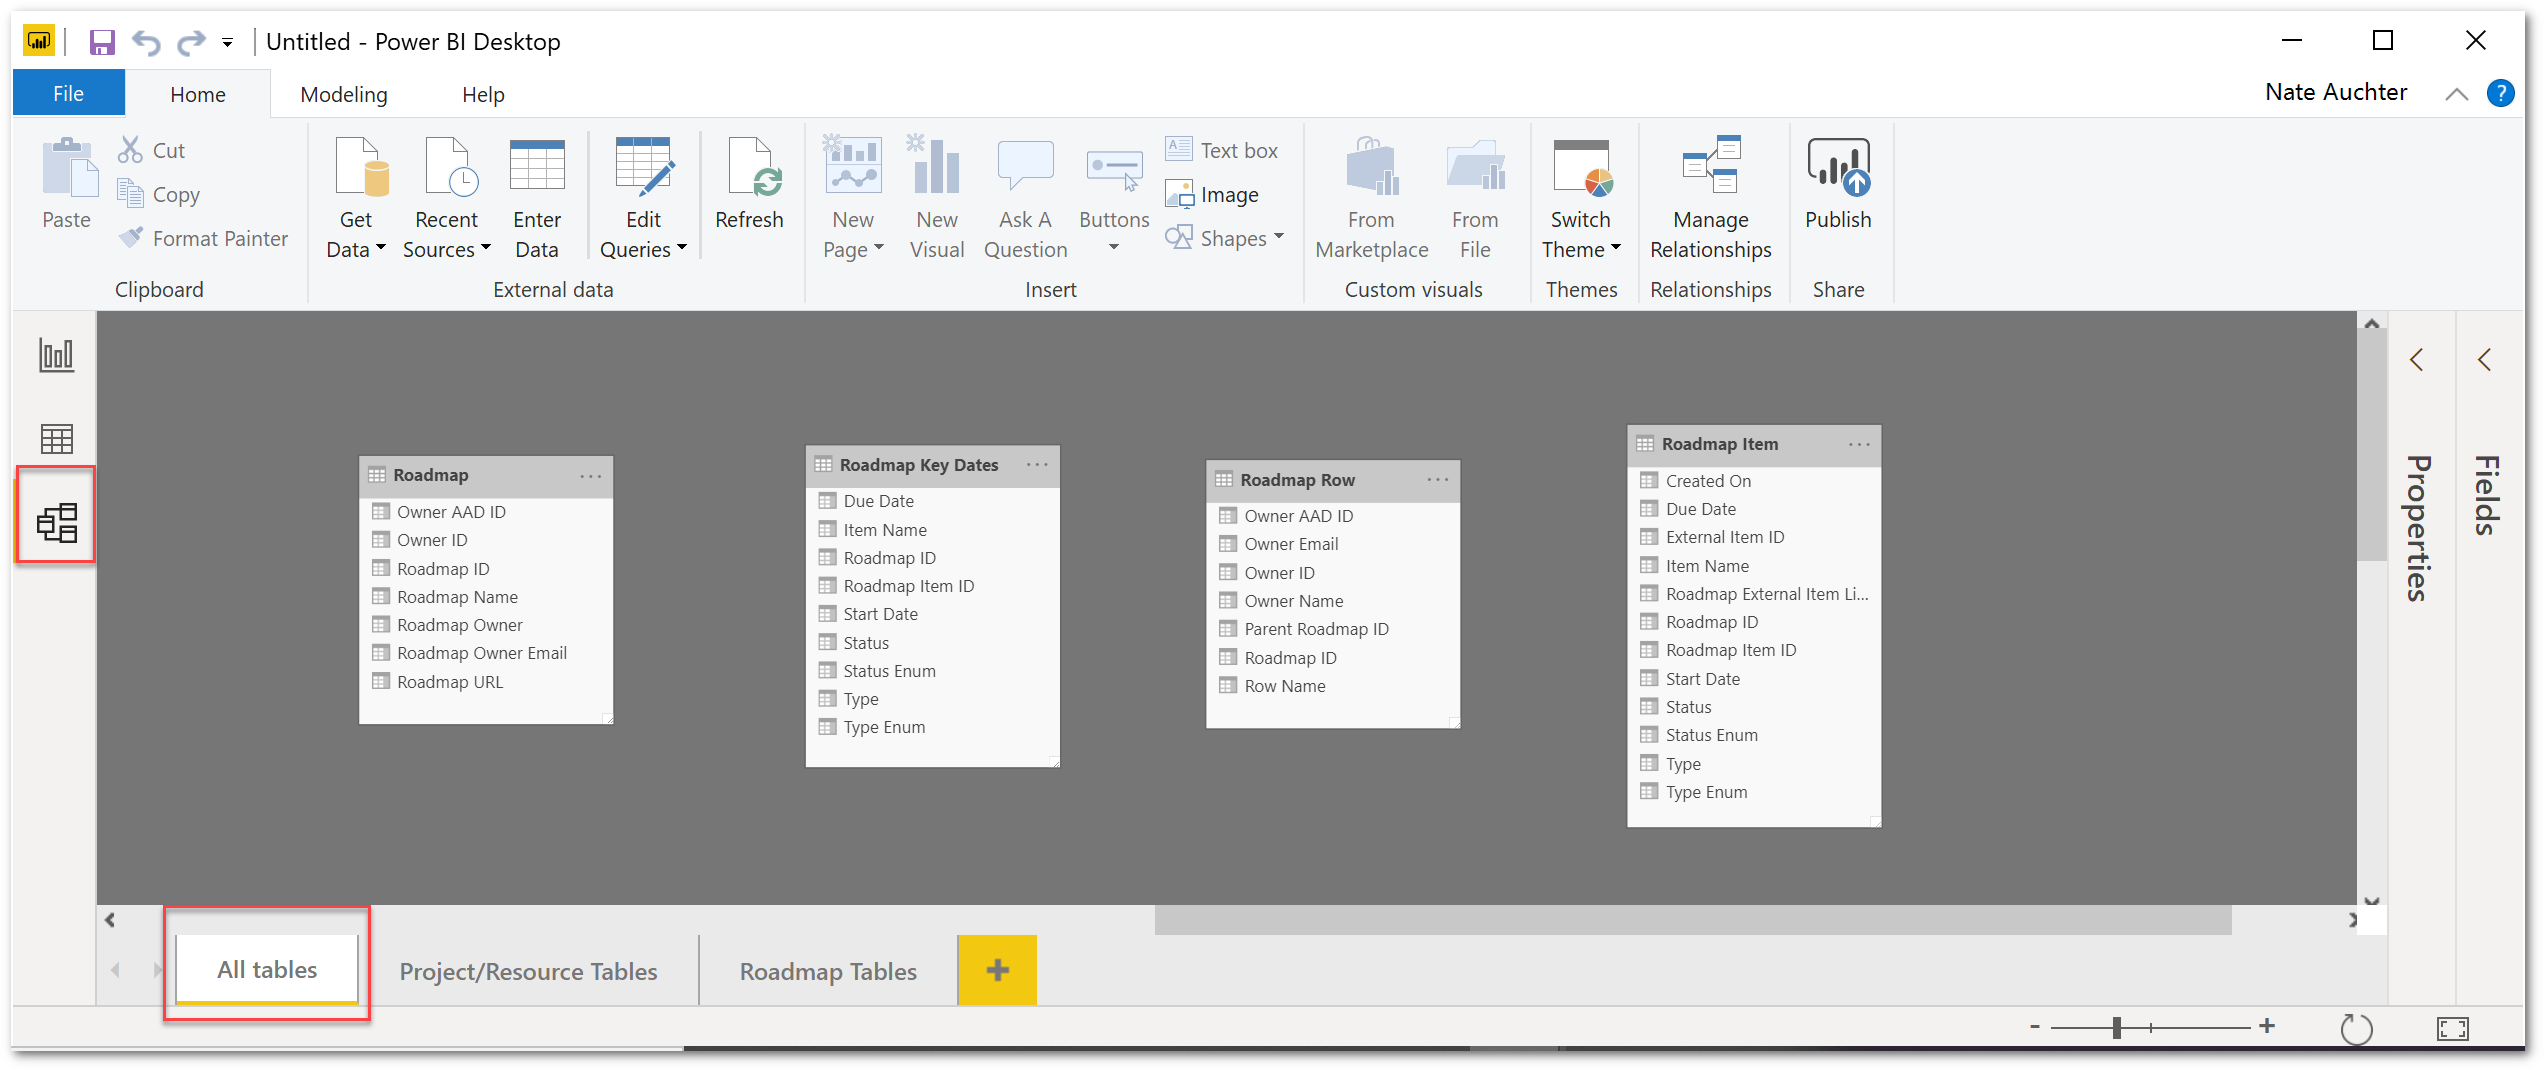
1. Navigate to the ‘Model’ View and select the ‘All Tables’ tab.
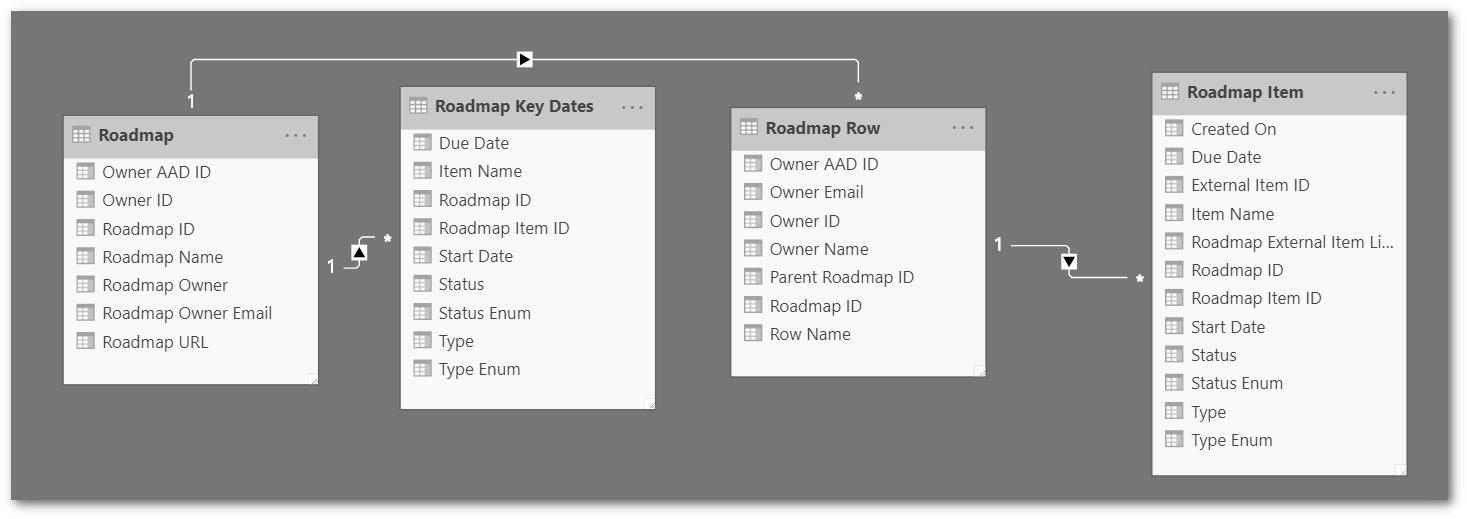
a. ‘Roadmap’ to ‘Roadmap Key Dates’ on the field in both called ‘Roadmap ID’
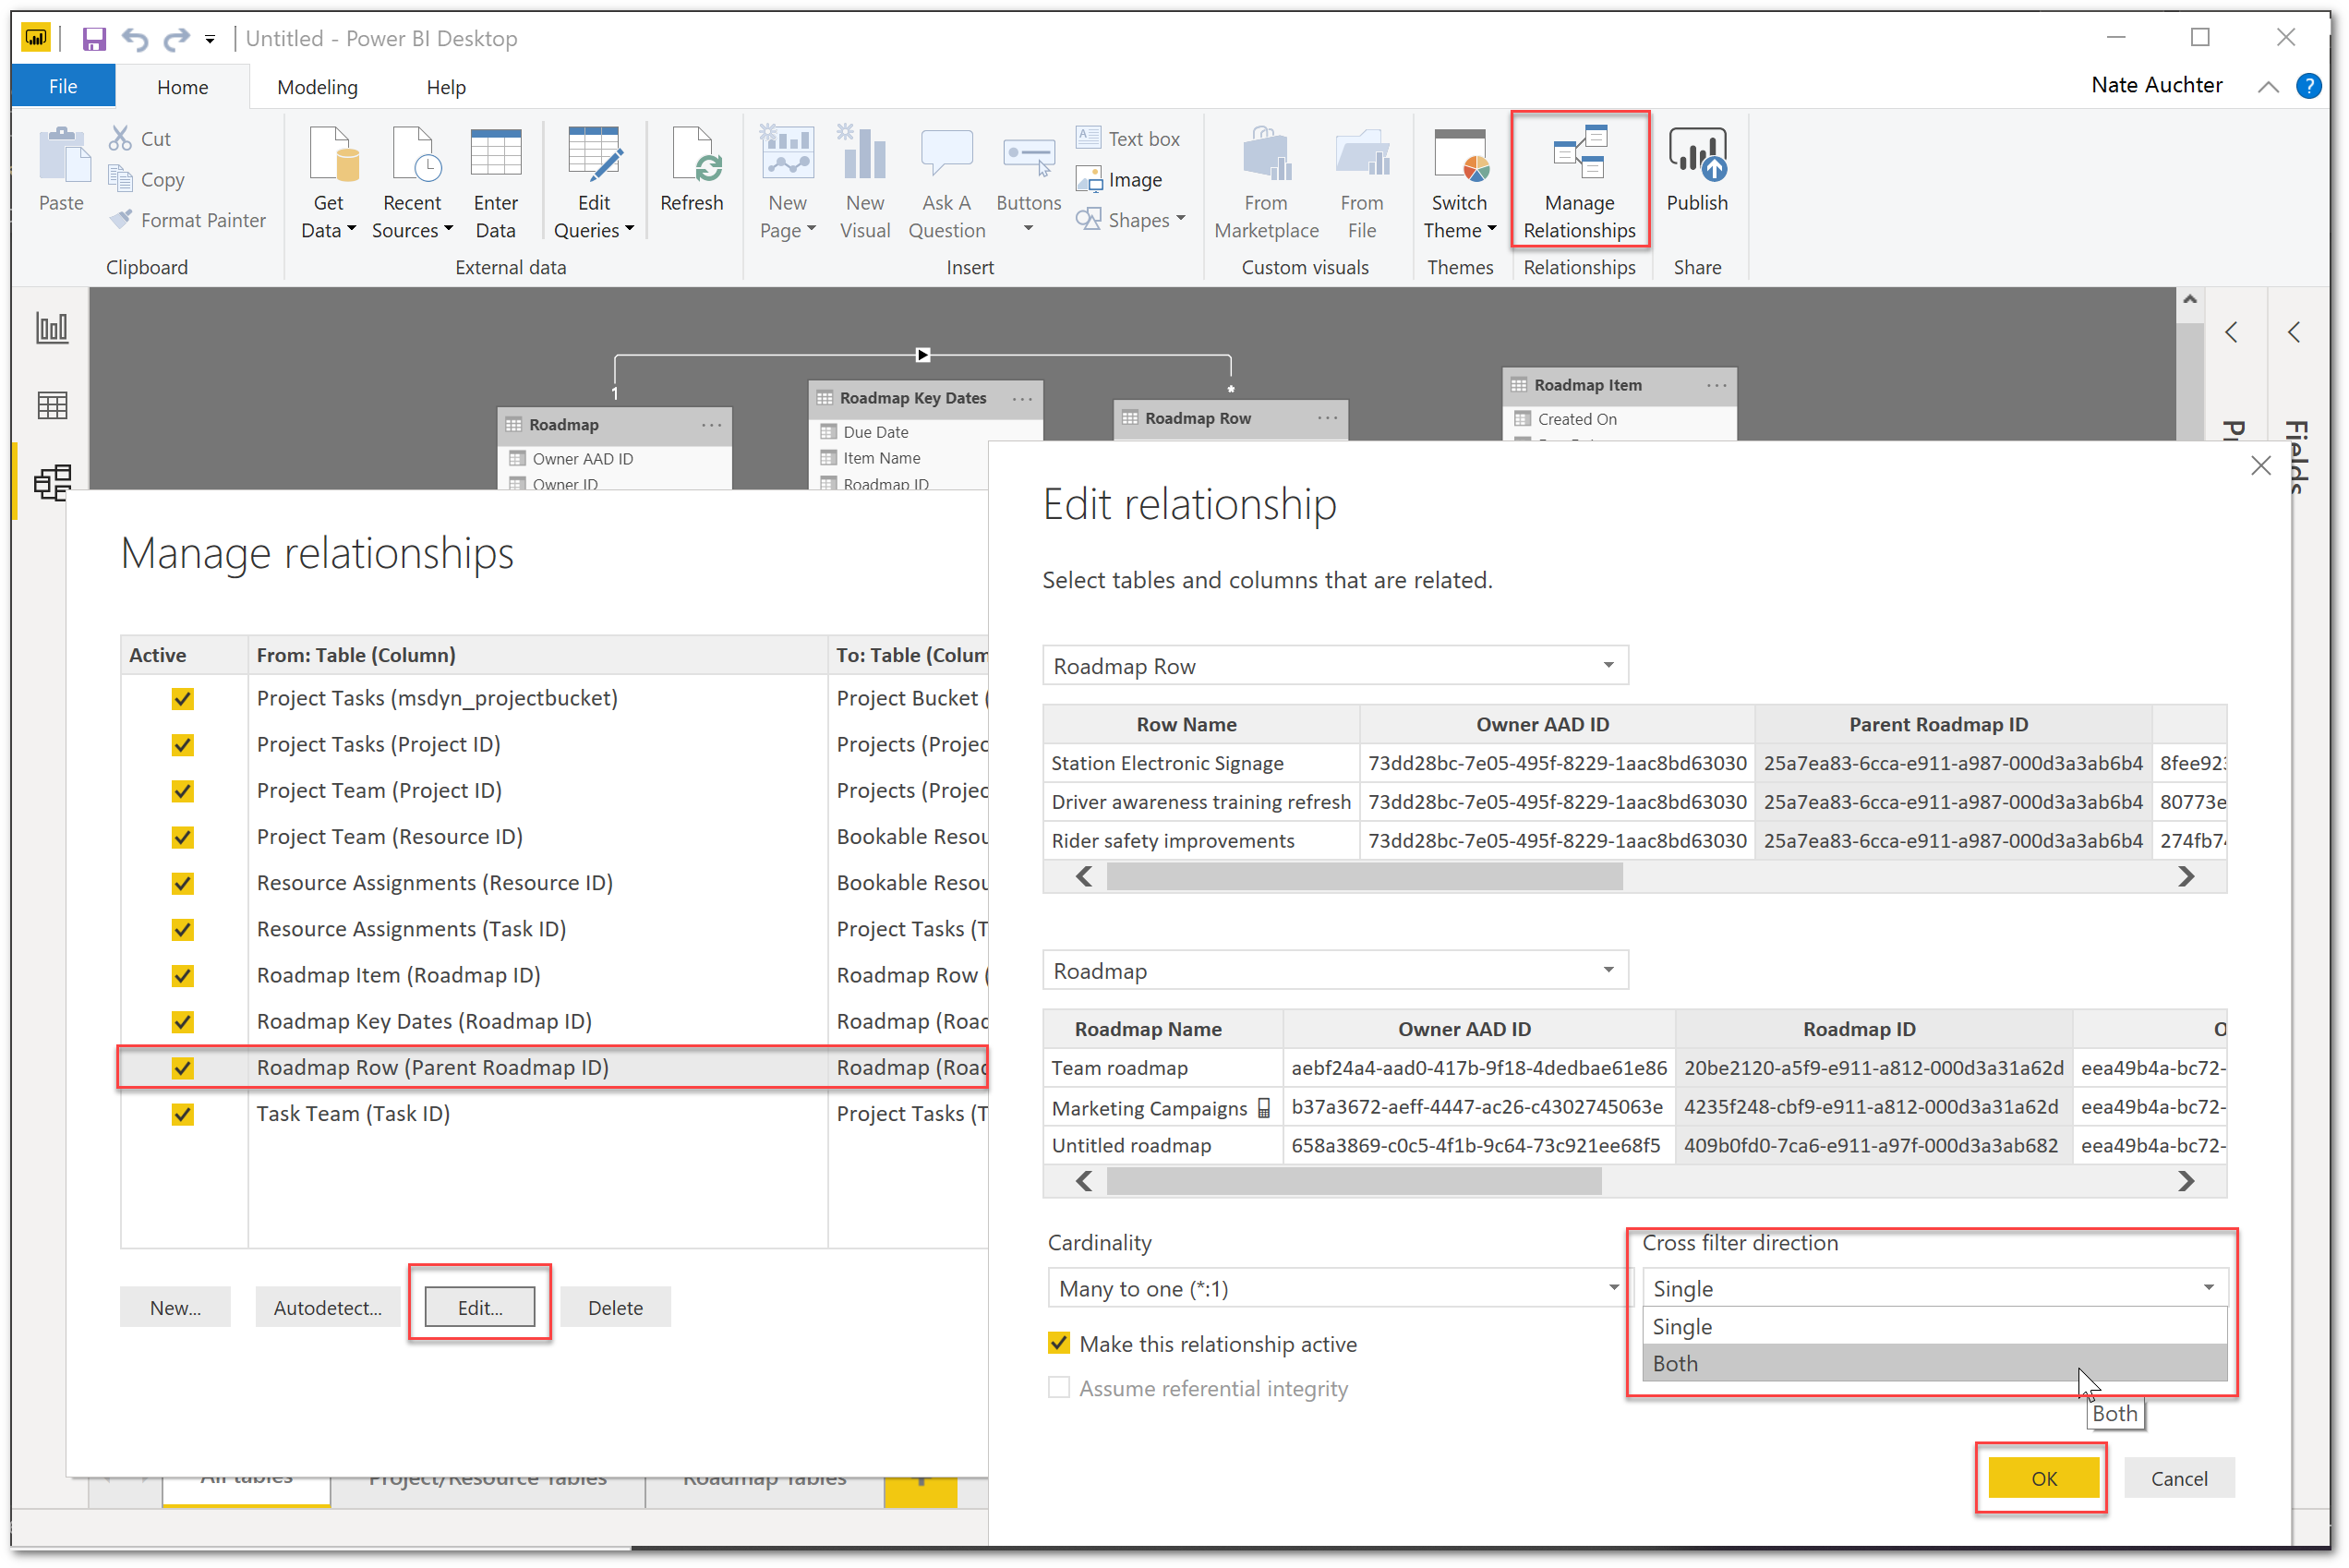
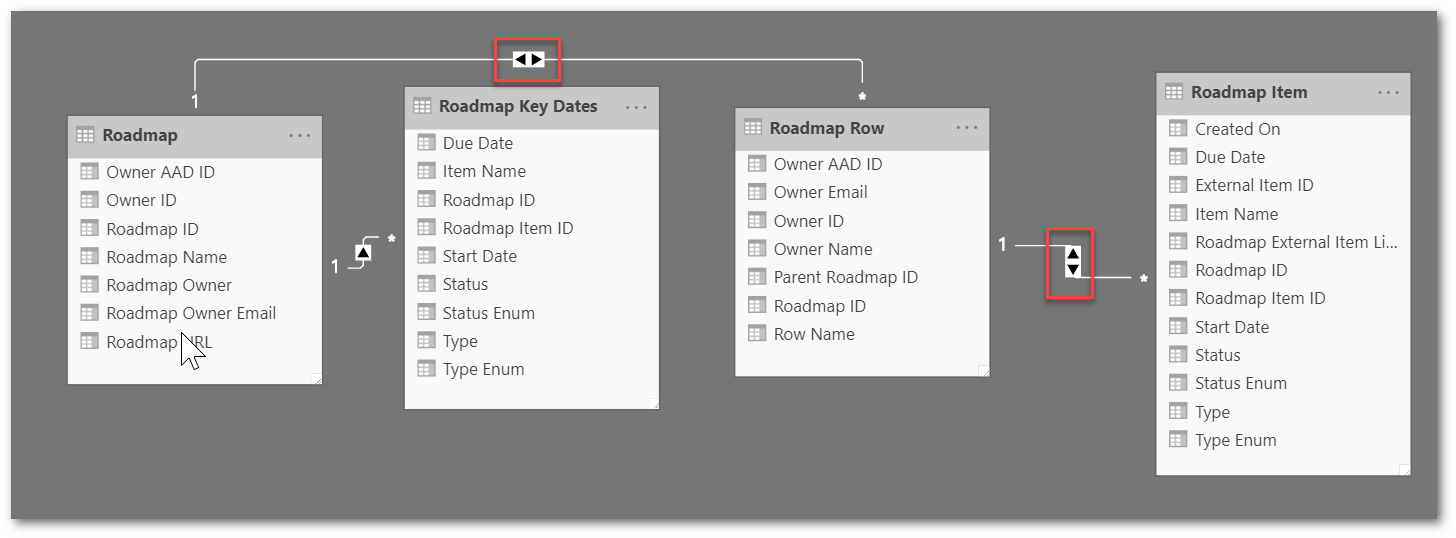
3. Optionally, you may choose to change the ‘cross-filter’ direction on relationships b and c above to “Both”. This would allow you to filter the Roadmaps and Roadmap Rows on an Item selection, or filter Roadmaps on a Roadmap Row selection. This is done by clicking ‘Manage Relationships’ from the ‘Home tab > Relationships section’, then selecting the relationship and clicking ‘Edit’, then changing the ‘Cross filter direction’ to ‘Both’.
The updated model will look like the diagram below.
|
|
|
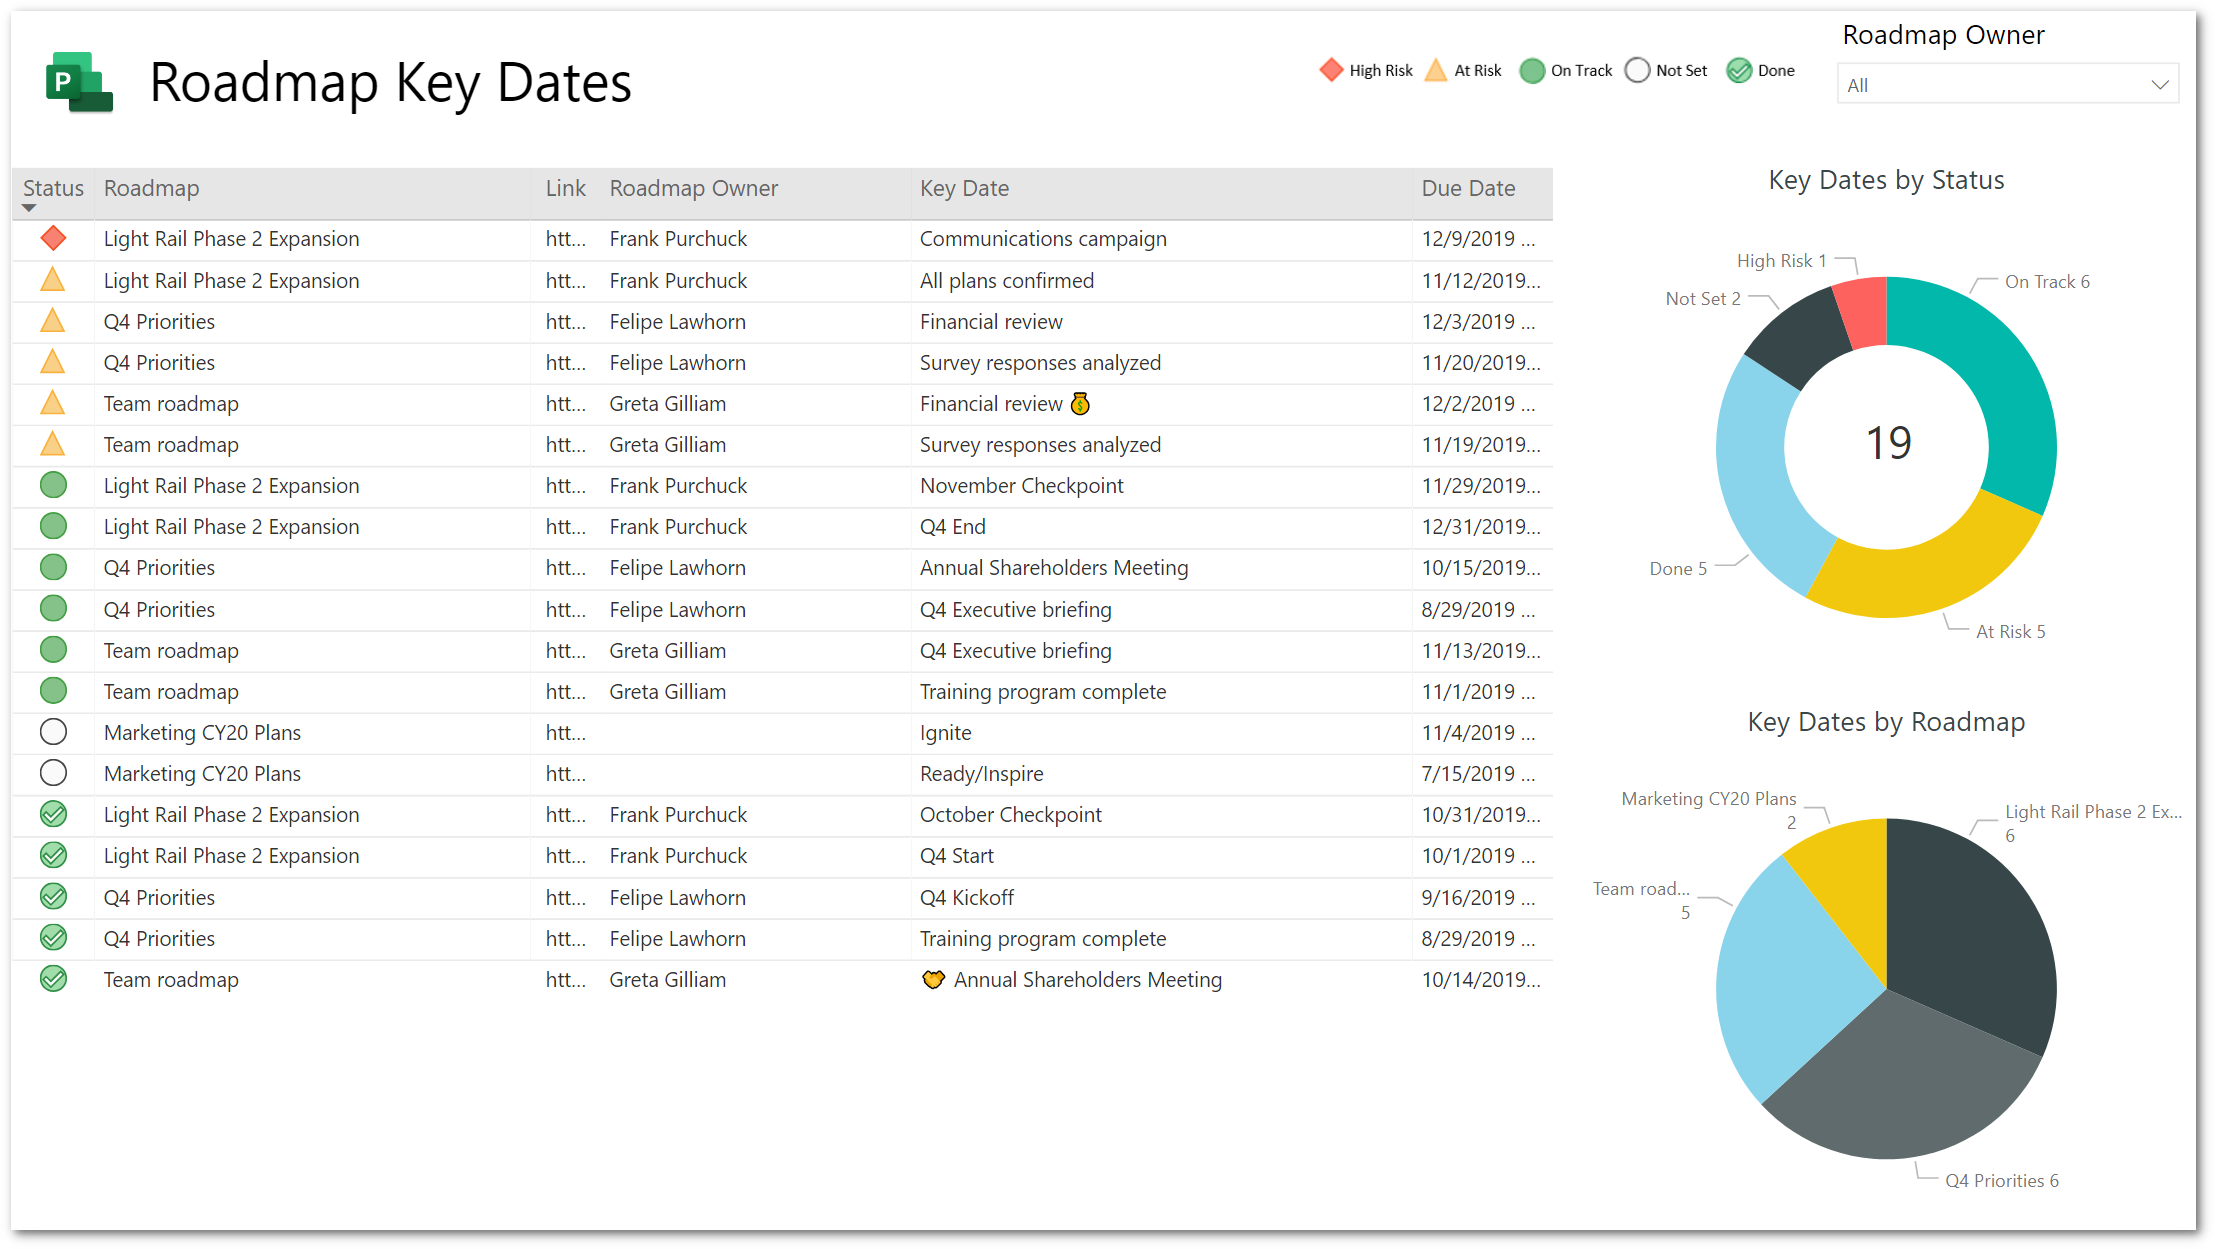
REVIEW THE REPORTS With the model updated with the new Roadmap relationships, you can now navigate back to the ‘Report’ view to view the two Roadmap pages, “Roadmap Key Dates” and “Roadmap Details”. Roadmap Key Dates
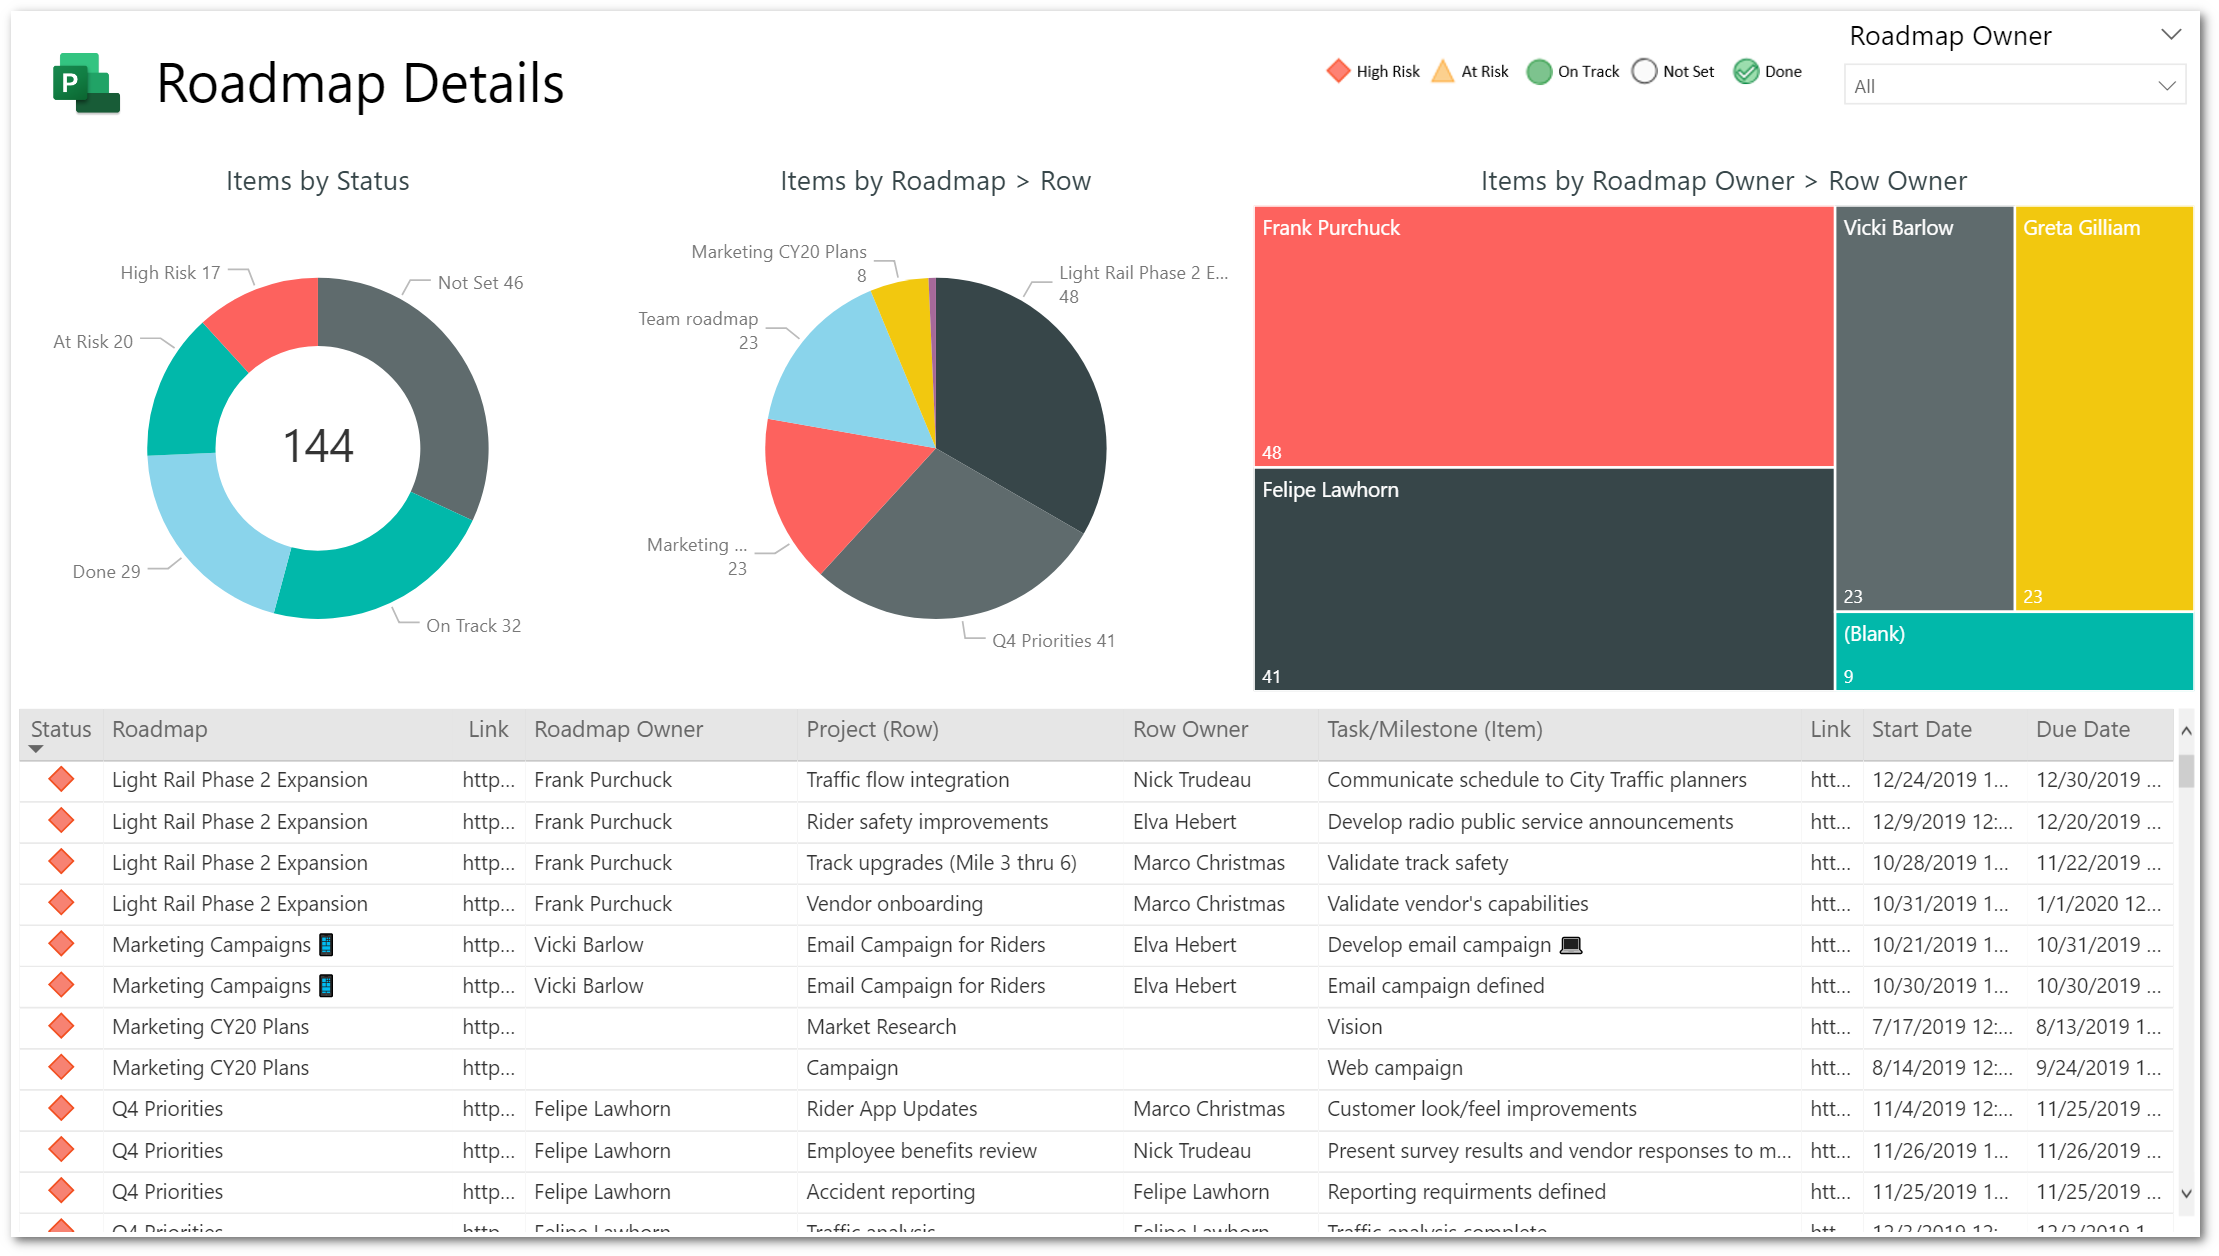
Roadmap Details
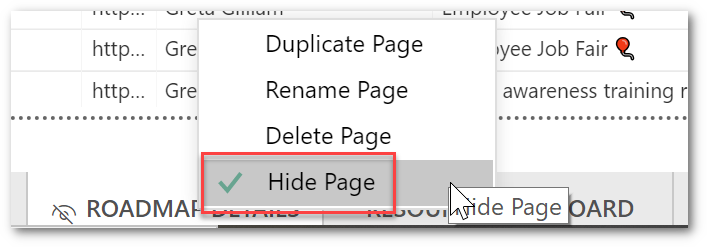
If you’d like these report pages to appear in the Power BI service when the report is published, you’ll need to “unhide” the pages. To do this, simply right click the tabs named ‘Roadmap Key Dates’ and ‘Roadmap Details’. Then, select ‘Hide page’ to turn off the ‘Hidden’ attribute. |
|
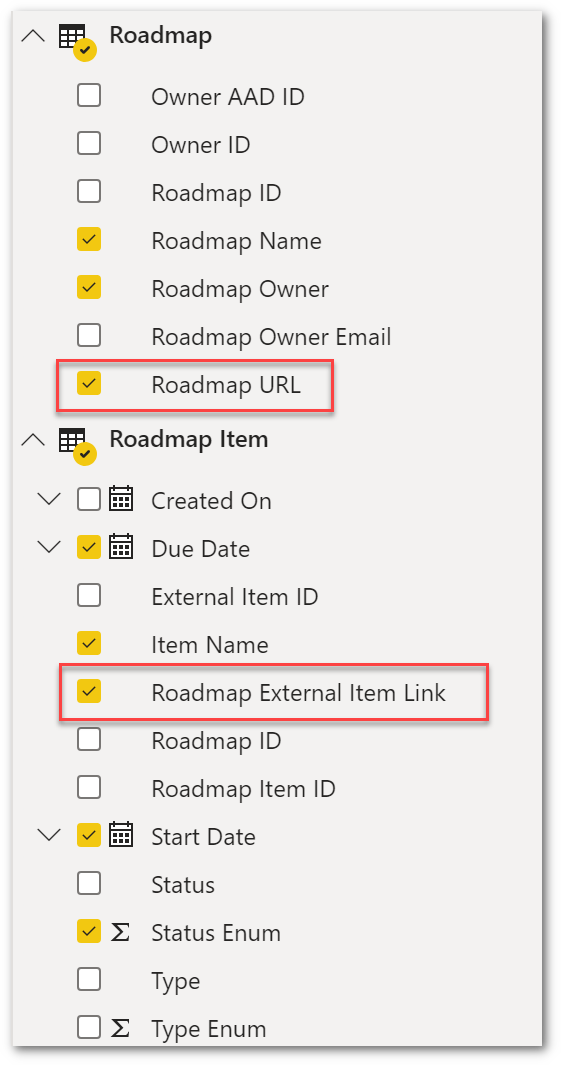
The last change you may want to make to the report is to enable the “Links” in the tables on both the ‘Roadmap Key Dates’ and ‘Roadmap Details’ as clickable hyperlinks. To do this, expand the ‘Roadmap’ and ‘Roadmap Item’ tables from the Fields pane and find the ‘Roadmap URL’ and ‘Roadmap External Item Link’ fields.
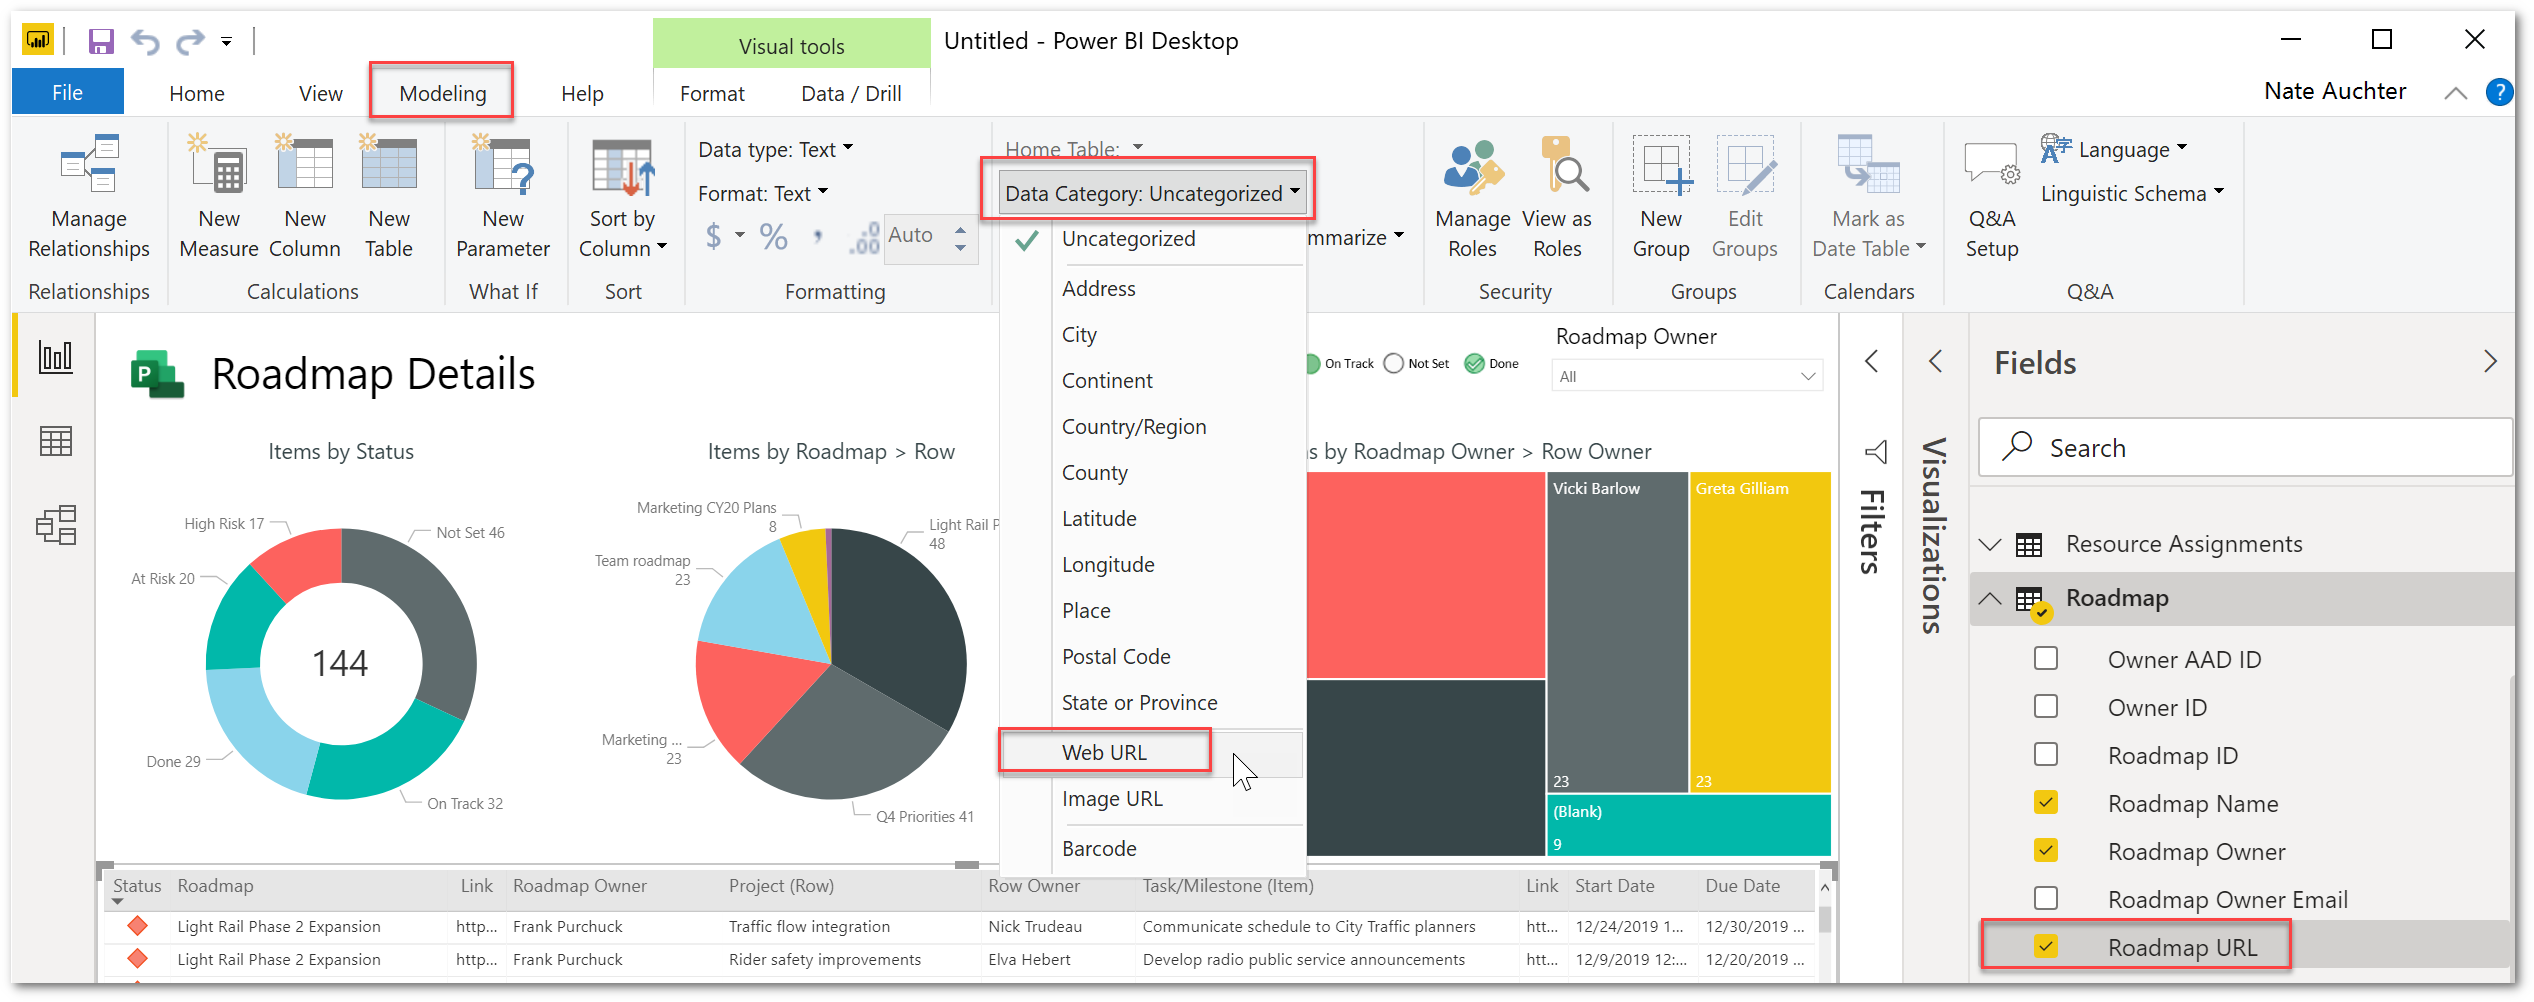
For each of these fields, select the field, then select the ‘Modeling’ tab, then ‘Data Category’ menu, then select ‘Web URL’.
|
|
| Once the data category is changed, the Link Icon will appear in the tables.
|
|
WHAT’S NEXT?
Now that you’ve enabled and reviewed the Roadmap report pages, you’ve got a more complete picture of your PPM Data from your Common Data Service. You can certainly extend or customize the pages further with data specific to your organization.
Happy reporting!
")